Introduction
Historically, we have worked with federal agencies, travelers, and the travel industry to improve the process of establishing federal lodging per diem rates. Since fiscal year 2005, lodging per diem rates have been based on average daily rate (ADR) data, less five (5) percent. ADR is a widely accepted lodging industry measure based upon a property’s room rental revenue divided by the number of rooms rented as reported by the hotel property to the contractor. The purpose of this page is to discuss three factors that influence the ADR that may result in federal lodging per diem rates that differ from published market rates. These three factors are:
- Property selection criteria
- Time frame of data
- Seasonality
It is important to note that each factor’s impact varies by market. A detailed description of each factor follows:
A. Property selection criteria
Part of our per diem methodology for determining market rates involves collecting average daily rate (ADR) data from specific properties that meet the GSA criteria.
Our criteria includes geography (i.e., ZIP codes to which federal employees travel), fire-safe certification, and various property demographics. STR ranks properties into luxury, upper upscale, upscale, mid-scale, and economy categories. The goal of the selection criteria is to choose properties best representing mid-range hotels in each market.
B. Time frame of data
Typically, we use ADR data from the trailing April-March.
C. Seasonality
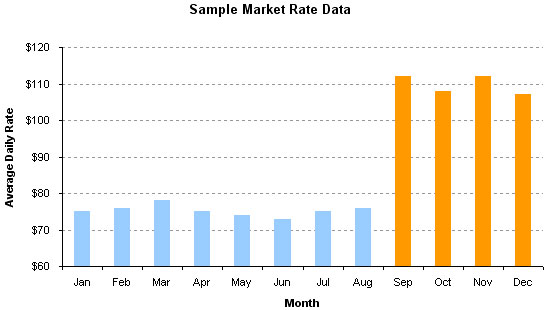
To better represent seasonal rate fluctuations, we have created seasonal rate periods in many markets where there is a sustained period (two or more months in length) where rates (ADR) are different from the preceding or following period by at least 15%. If there is an ADR difference between 10 and 14% of a sustained period and the occupancy rate level for this same period is 70% or more, this period also becomes a season. Once a season has been defined, the ADR for all seasons is computed using the current lodging data ending in March. We use the same properties for rates and seasonal determination; however, three years’ worth of data is used to determine seasons. The graph below shows an area with two seasons:


 U.S. General Services Administration
